Australia
7 destinations across 1 country, from 113 to 1561 metres, ranked by their strongest scored month.
How many of the 7 destinations clear the recommendation gate in each month.
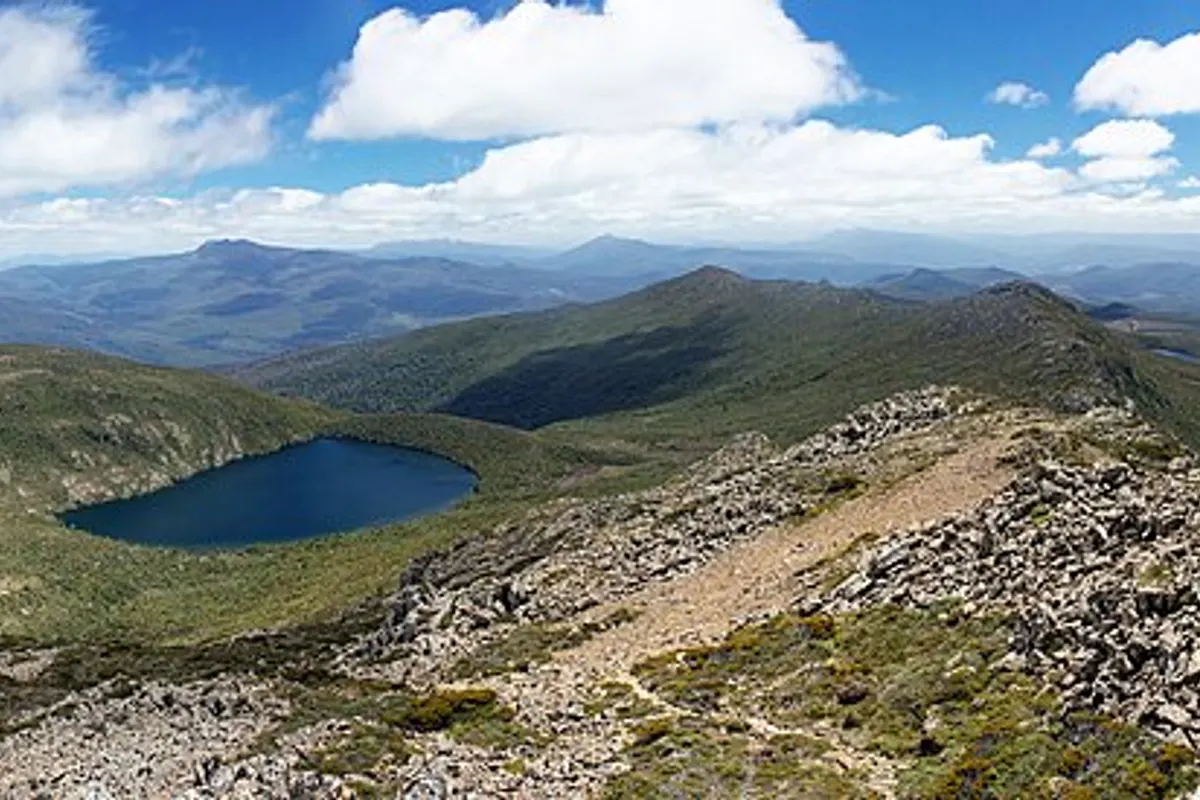
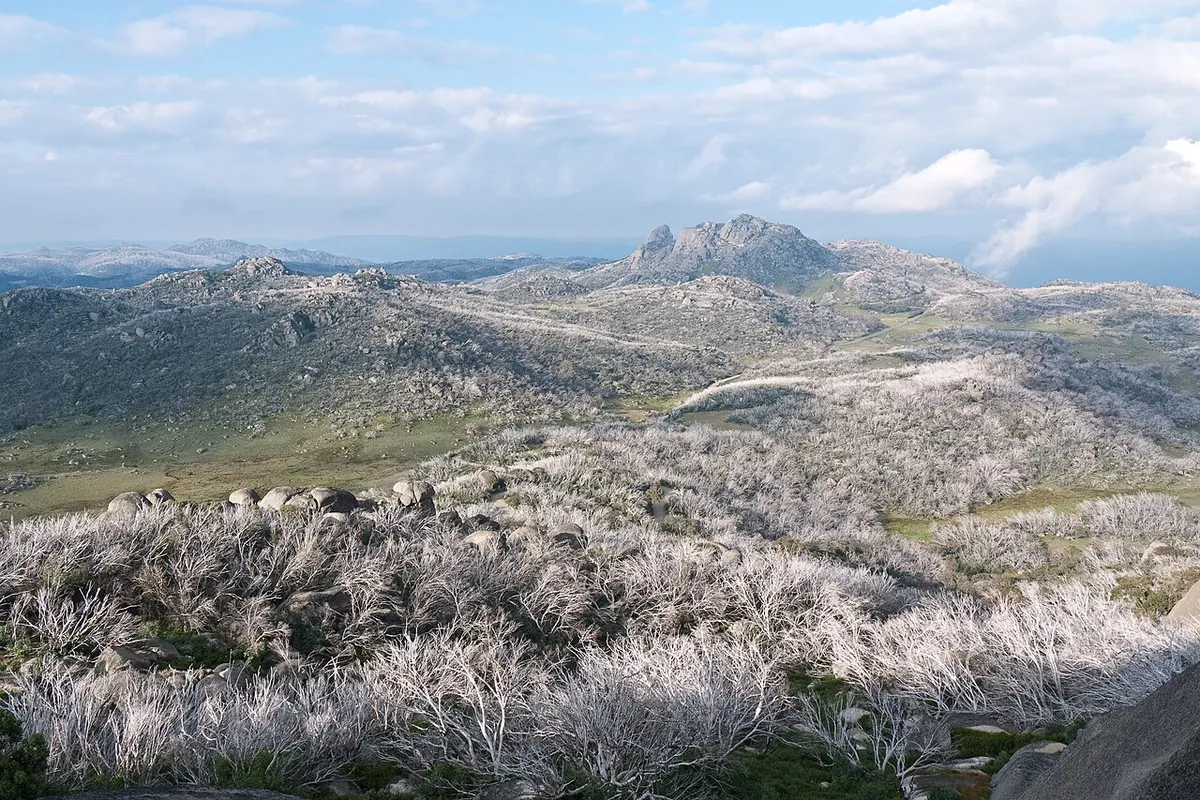
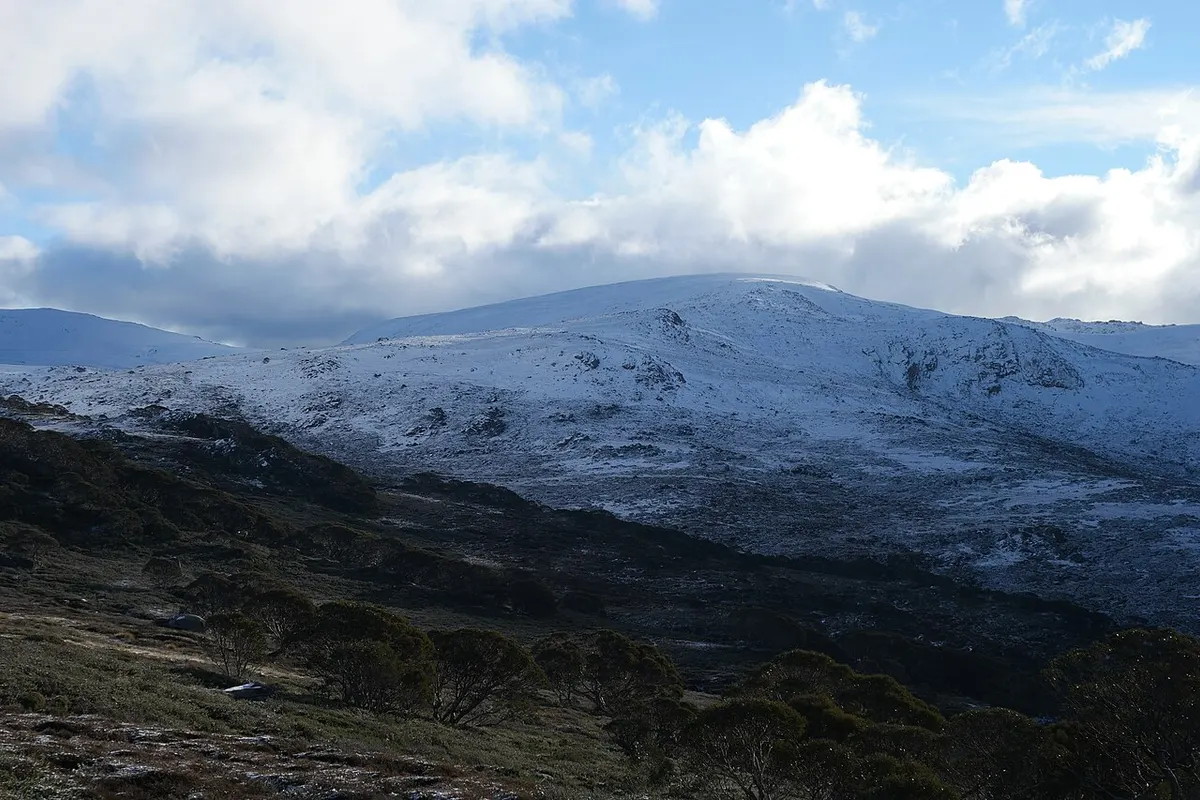
From February to May and from September to December, all 7 destinations clear our recommendation criteria. The area is quietest in January and from June to August, with 6 of 7.
Averaged across the destinations, January is the warmest month at 22 degrees in the hiking window and July the coldest at 9. Every destination here is in the southern hemisphere.
The selected grid cells run from 113 metres at Wilsons Promontory to 1,561 metres at Kosciuszko, with a median of 696 metres. Wilsons Promontory clears the criteria in 12 months (all year), Kosciuszko in 9 months (all year except June, July and August).
The longest season belongs to 5 destinations, including Wilsons Promontory and Lamington, at 12 months each; the shortest to Kosciuszko, at 9 months (all year except June, July and August).
Where a destination loses months, a critical climate component falls below the threshold at which we stop recommending a month. The main reason is heat for 1 of the 7 destinations and snow cover for 1. 5 are recommendable in all twelve months.
In January, the quietest month, 1 of 7 destinations are closed, all of them by heat.
April is when the open destinations score highest on average. Hiking-window temperature then runs from 11 degrees at Kosciuszko to 20 at Lamington, and rain falls on 13 to 40 percent of days depending on the destination.
Each destination is described by one selected ERA5-Land grid cell, averaged over 1991 to 2025. The figures above summarise those 7 cells. They are not a map of the whole area or of any route, and they are not a forecast.