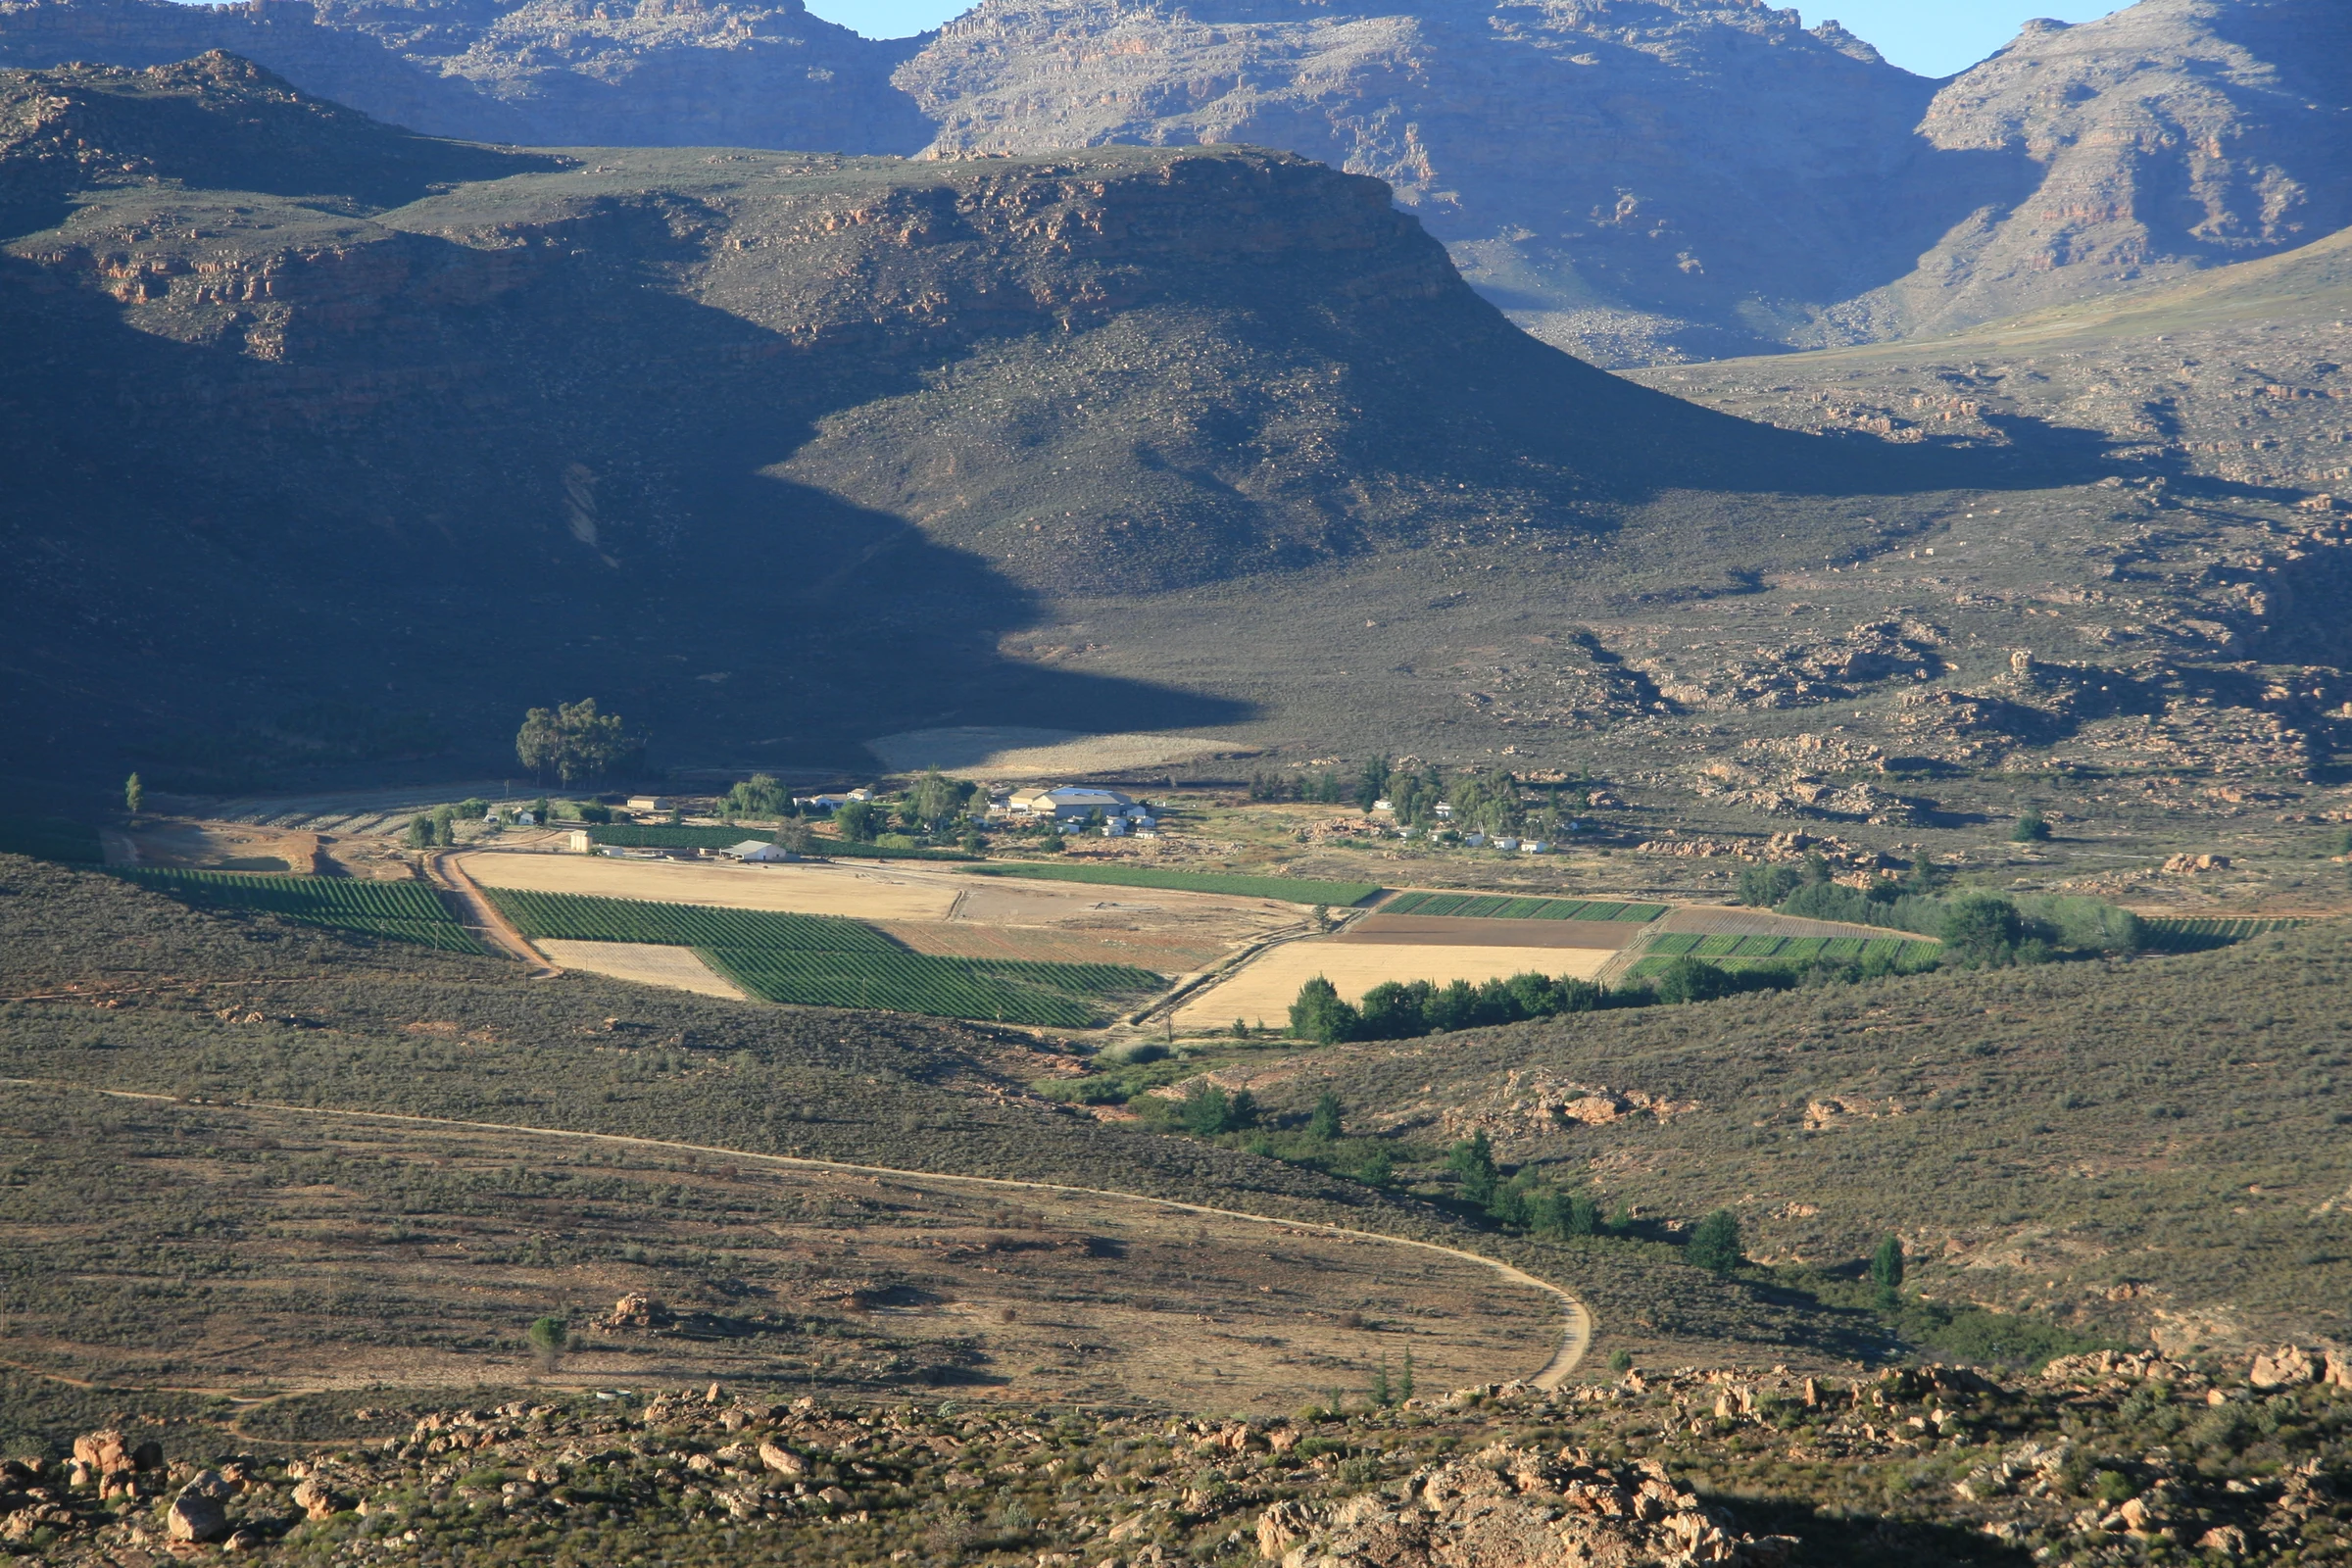
Cederberg landscape
South Africa · Cape Fold Mountains

Best time to hike Cederberg

Selected representative ERA5-Land grid cell at about 888 m; not a claim about every route across the region.

Plan with real conditions

Compare the hiking year

Start with these months

The existing model's best months. Compare the conditions below before choosing a route.

Swipe sideways to compare all conditions →

Historical climate conditions, not a forecast. Months without a recommendation are not linked to a hiking recommendation page.
MonthHiking-hour temperatureWet days per monthDays with modelled snowDaylightSeason guide
January26.2°C≈ 2.60%14 h 00 minNo recommendation
February26.1°C≈ 2.40%13 h 12 minNo recommendation
March →23.9°C≈ 40%12 h 18 minView month
April →20.0°C≈ 4.60%11 h 18 minView month
May →16.1°C≈ 6.40%10 h 30 minBest month
June →12.4°C≈ 8.40.2%10 h 00 minView month
July →11.7°C≈ 7.81.2%10 h 12 minView month
August →12.5°C≈ 8.10.7%11 h 00 minView month
September →15.4°C≈ 5.70.1%11 h 54 minBest month
October →19.4°C≈ 4.90%12 h 54 minBest month
November →21.8°C≈ 4.10%13 h 48 minView month
December →24.3°C≈ 3.20%14 h 12 minView month

What these numbers describe

Historical climate at one selected model cell. Higher routes, sheltered valleys and exposed ridges can differ substantially.

Model elevation: 888 m · Historical period: 1991–2025

Trail wind is not available here. This model does not resolve exposed ridges or gusts; check a local mountain forecast.

How to read these figures

Selected cell: -32.5, 19.1

Temperature sampling window (local time, limited to daylight): 08:00–18:00.

A wet day has at least 1 mm of total precipitation (including snow water equivalent). It may rain for only part of the day.

A snow day meets either model threshold: 10% snow cover or 2 cm snow depth.

Turn the climate into a trip

Choose a specific route and check its distance, ascent, difficulty, current access and forecast. These are not supplied by the climate model.
Elevation view

One reproducible reference point

The monthly value represents the selected representative ERA5-Land grid cell. It deliberately does not pretend to describe every route across the region.

-32.5, 19.1 · 888 m

representative837–938 m100% weight
Months we do not recommend

2 months do not clear the gate

The record for these months is complete. They carry no hiking score because at least one critical component is at or below 20, and we would rather say so here than publish a weak recommendation.

Similar alternatives

Keep exploring

Cederberg through the year

Cederberg sits at about 887.5 metres and has no closed hiking season. In all 10 scored months, temperature, rainfall and snow stay inside the limits at which we withhold a recommendation. Temperature moves 14.5 degrees across the year, from 12 in July to 26 in January.

How the months differ

Although the whole year clears the recommendation gate, the months are not interchangeable. Rain falls on about 8 percent of days in January, compared with 28 percent in June. Hikers prioritising drier conditions should start with January, then compare its temperature with January.

Why January to February are missing

In January the hiking-window temperature reaches 26 degrees. We withhold January to February because sustained heat makes a walk a question of time of day and water, rather than of season.

Conditions in September

The strongest scored month is September: about 15 degrees in the hiking window, rain on 19 percent of days, and 12 hours of daylight.

What these figures cover

Every figure comes from one selected ERA5-Land model grid cell at -32.50, 19.10, 887.5 metres, averaged over 1991 to 2025. It describes that point rather than every route in the region, and it is not a forecast. Wind is coarse 10 metre grid wind, not a statement about exposed paths or gusts.

Quick answers

Questions about Cederberg

When should you hike Cederberg?
10 of twelve months clear our criteria, and September scores highest.
Why are some months not recommended?
In 2 months at least one critical component falls below the threshold, most often heatStress.
What do these figures describe?
One selected ERA5-Land model grid cell at 887.5 metres, averaged over 1991 to 2025. It is not a forecast and not a statement about individual trails.
Guided experiences

Tours and activities around Cederberg

Add a guided walk, a boat trip or a local experience after checking that the climate fits your plans.

Find a baseCederberg landscape
Find a base

Where to stay around Cederberg

Choose a practical base for your hiking days. Compare current availability, prices and cancellation terms on Booking.com.

Booking.comFind places to stayCheck the date, meeting point, difficulty, inclusions, trail access and cancellation terms before booking.

Affiliate disclosure: if you book through a labelled link, we may earn a commission at no extra cost to you.