Indonesia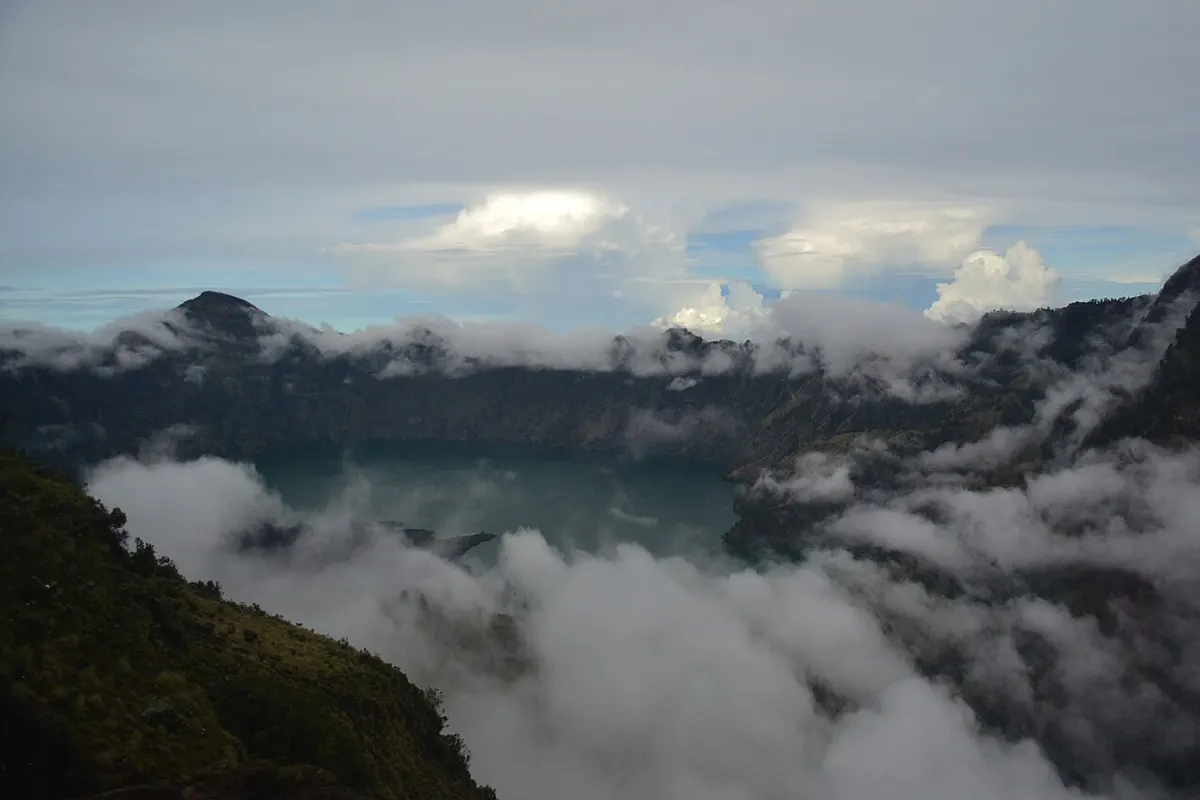
8 destinations across 5 countries, from 1179 to 1815 metres, ranked by their strongest scored month.
How many of the 8 destinations clear the recommendation gate in each month.
July · August · September
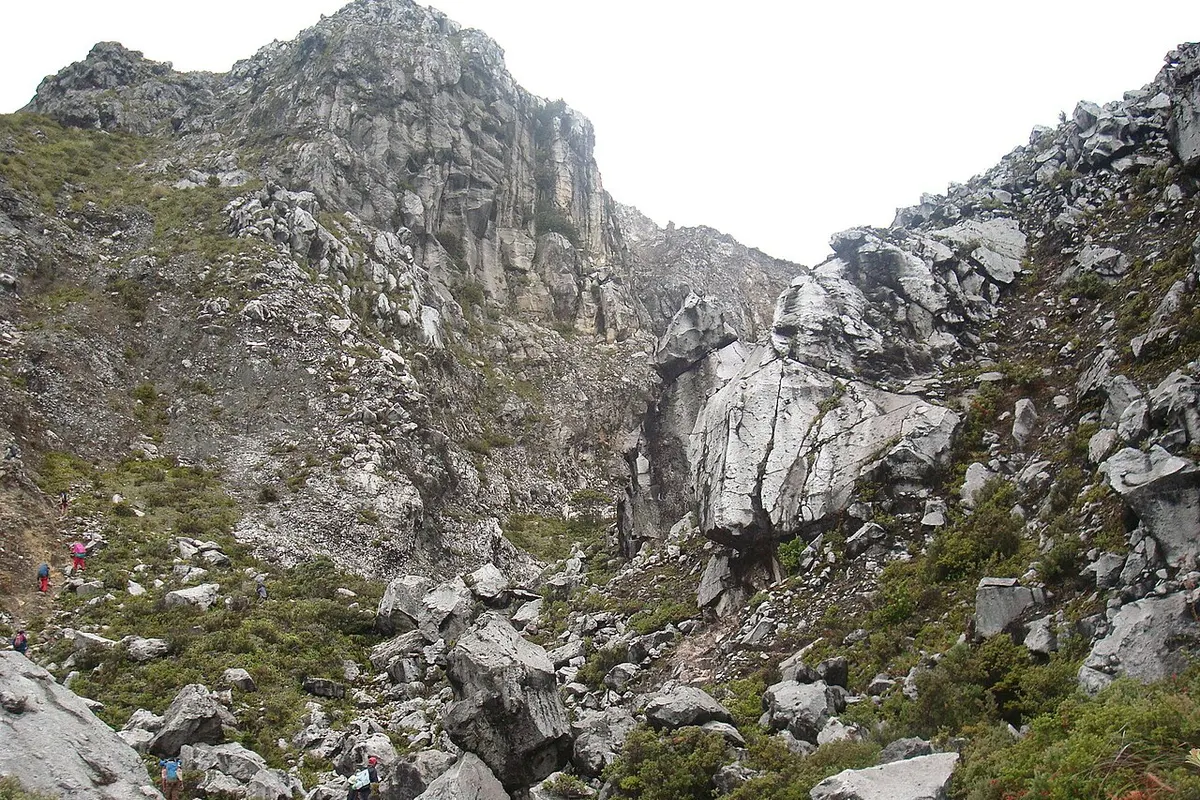
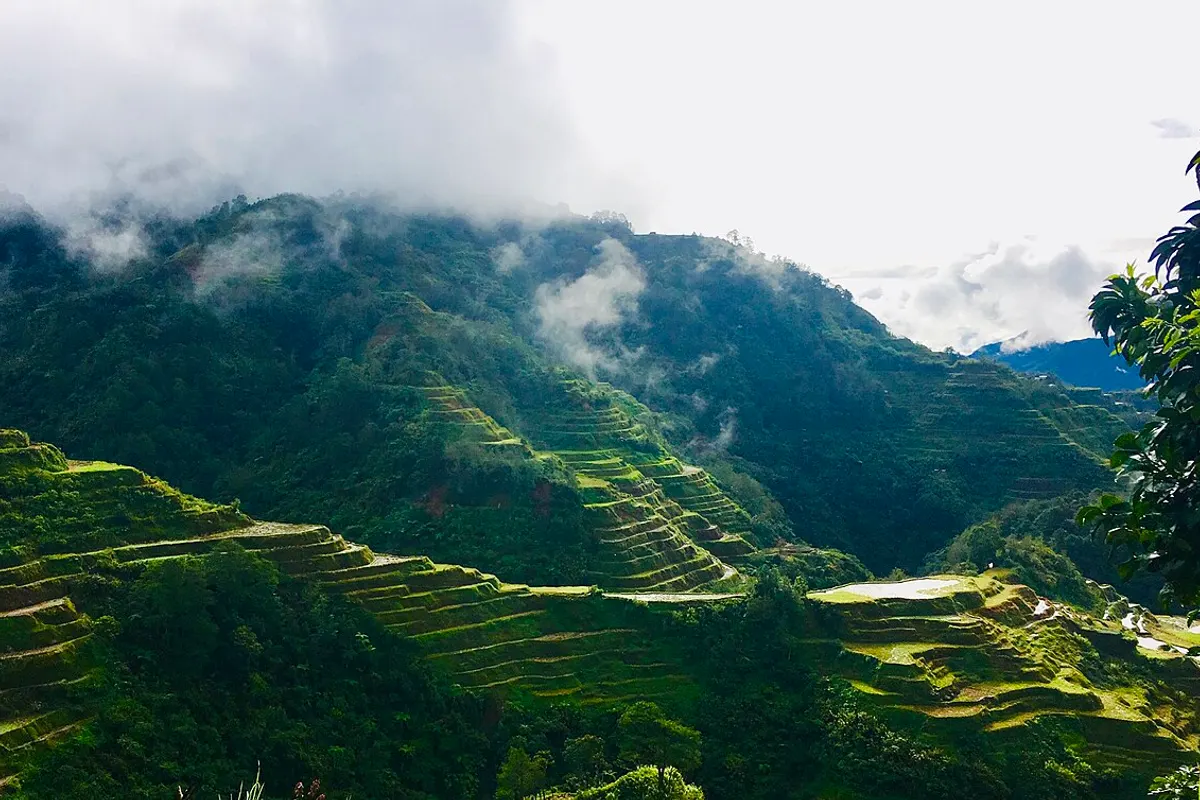
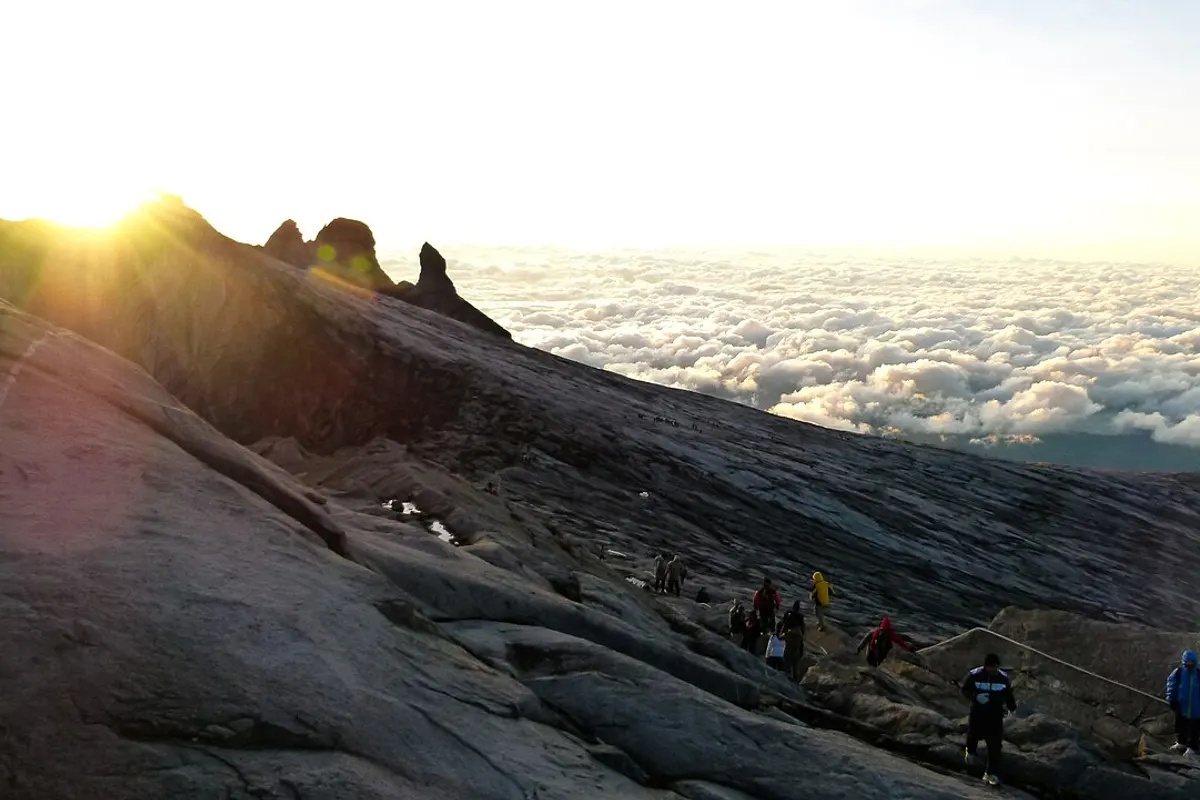
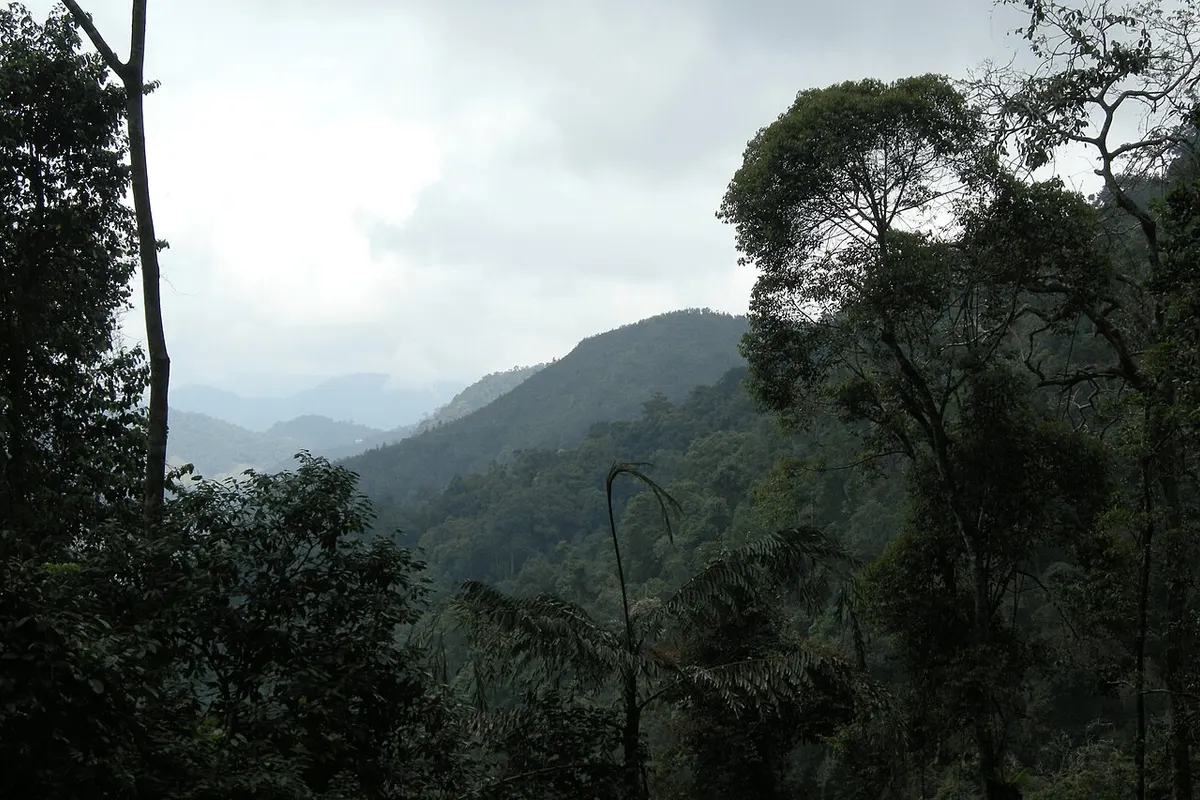
All year except April, all 8 destinations clear our recommendation criteria. The area is quietest in April, with 7 of 8.
Averaged across the destinations, April is the warmest month at 22 degrees in the hiking window and January the coldest at 19. 2 of the 8 destinations lie in the southern hemisphere, where the year runs the other way.
The selected grid cells run from 1,179 metres at Banaue to 1,815 metres at Mount Kinabalu, with a median of 1,606 metres. Both clear the criteria in 12 months (all year).
The longest season belongs to 7 destinations, including Mount Rinjani and Bromo Tengger Semeru, at 12 months each; the shortest to Doi Inthanon, at 11 months (all year except April).
Where a destination loses months, a critical climate component falls below the threshold at which we stop recommending a month. The main reason is heat for 1 of the 8 destinations. 7 are recommendable in all twelve months.
In April, the quietest month, 1 of 8 destinations are closed, all of them by heat.
August is when the open destinations score highest on average. Hiking-window temperature then runs from 20 degrees at Mount Kinabalu to 24 at Banaue, and rain falls on 9 to 97 percent of days depending on the destination.
Each destination is described by one selected ERA5-Land grid cell, averaged over 1991 to 2025. The figures above summarise those 8 cells. They are not a map of the whole area or of any route, and they are not a forecast.